DashF1Product story · 4 min read
Follow the driver. Keep the race in view.
A race dashboard connecting timing, track context, and replay while distinguishing measured data from estimated positions.
Read the case study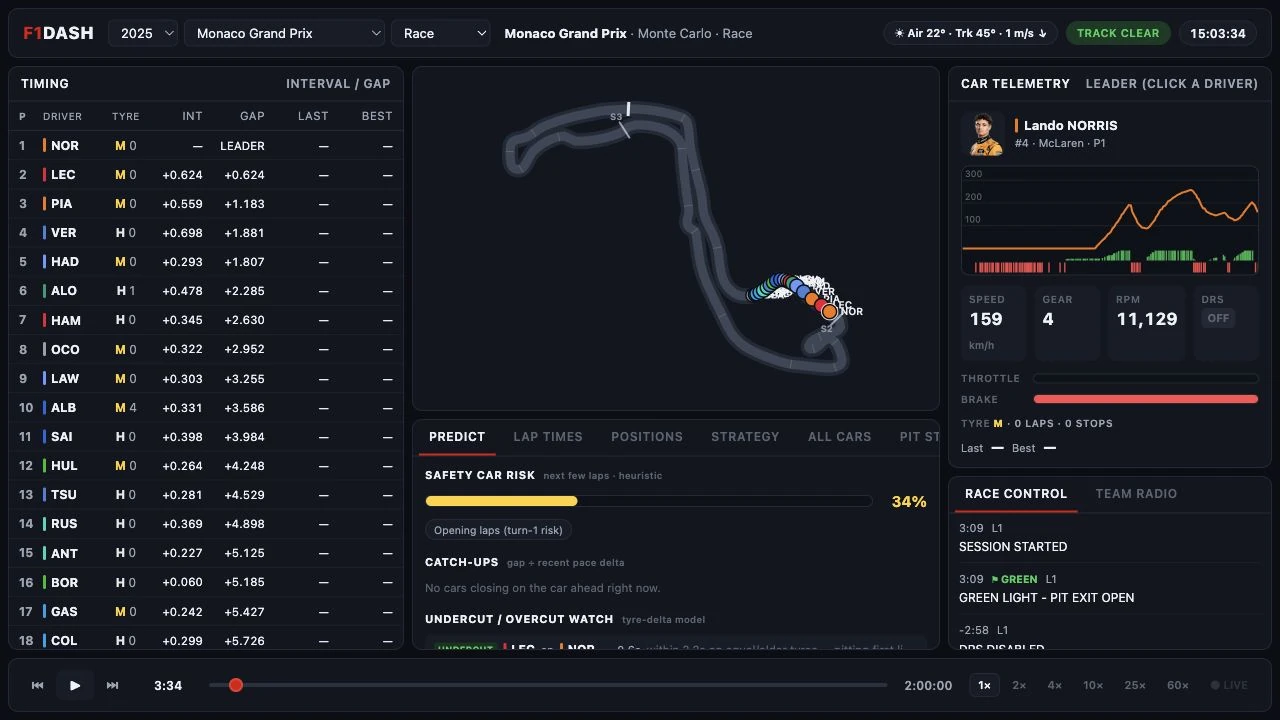
Actual local dashboard replaying the 2025 Monaco race from OpenF1 data. The prediction panel labels its heuristic estimates.
View full size ↗01 The problem
What should the dashboard do when its data coverage changes?
A race weekend produces more signals than a person can follow at once, and the available feed changes between live and replay sessions. DashF1 uses one shared driver focus across the timing tower, map, and detail views so the dashboard supports a question rather than a wall of independent charts.
Designed for Race follower tracking a driver. Keep one driver in context while following the race.
User context Design assumption
Moving between timing, track position, and available detail.
- The friction
- Repeated selections and uneven data coverage disrupt the story.
- Design implication
- Synchronise focus and explain each mode’s coverage.
Example situation · illustrative scenario. Imagine following two drivers through a race weekend. Timing, position, tyres, and telemetry compete for attention—and not every channel is available in every session.
02 The direction
One focus across panels
A smooth marker can still be an estimate. The mode should determine the promise the interface makes.
Product artifact · live and replay modes
My direction. I used one driver focus across the dashboard and separate live/replay modes that respect the available information.
Process and product scope
I organised the experience around one driver focus. Timing, track context, and detail panels should answer related questions without requiring the same selection repeatedly.
I separated live and replay expectations. When a position is estimated, the label belongs near the moving marker; missing coverage should be understandable at the moment someone tries to use it.
- 1
- driver focus across panels
- Live / replay
- distinct data modes
- Estimated
- free-feed track positions
- Focus
Choose the driver once.
- Connect
Carry that focus across panels.
- Interpret
Distinguish measured channels from estimated positions.
03 The outcome
Follow the driver through the available data.
I organised timing, track position, telemetry and replay around one selected driver. The selection carries across panels, while session mode and data coverage explain what each view can show. Estimated positions need to stay visibly different from recorded data.
More about the experience
- Shared focus. A selected driver carries across timing, track position and available detail.
- Coverage has boundaries. The product distinguishes live estimates from richer replay data.
04 Design decisions
Keep one driver in focus across the dashboard.
Open a decision to see the reasoning and trade-off.
01Carry one selection through the dashboard
Choosing a driver updates the relevant map and telemetry context.
Why this matters. The person should not have to repeat the same selection in several panels.
The trade-off. The relationship must remain clear when the selected driver retires or a particular data channel is unavailable.
02Let the mode determine the promise
Live mode shows supported channels; fuller replay data becomes available through a separate path.
Why this matters. Missing data should change the interface’s promise instead of being replaced with plausible-looking numbers.
The trade-off. A mode change can alter familiar panels, so the dashboard needs an understandable explanation.
03Label an estimate at the point of use
The documented free-feed map derives position from mini-sector timing and gaps, and calls it estimated.
Why this matters. Visual continuity is useful, but it should not be mistaken for location precision the feed does not provide.
The trade-off. Race interruptions and stale timing can challenge the estimate; smooth motion must not conceal those limits.
05 Reflection
A useful dashboard can say less when it knows less.
I would check what someone believes when a feed is incomplete. An empty or estimated view should be understandable without making them leave the race to read a technical explanation.
What I would evaluate next proposed work
- ask a viewer to follow a battle and explain which values are observed, historical, or estimated.
- missing telemetry, stale updates, interrupted streams, safety-car periods, and the transition back to replay.
One colour. A reason to look closer.